Last updated:
A1C Conversion Chart: HbA1c to Glucose Table
Complete A1C to glucose and glucose to A1C conversion tables with mg/dL, mmol/L, and diabetes risk categories.
Quick A1C calculator
Enter your A1C to convert it to estimated average glucose in mg/dL and mmol/L.
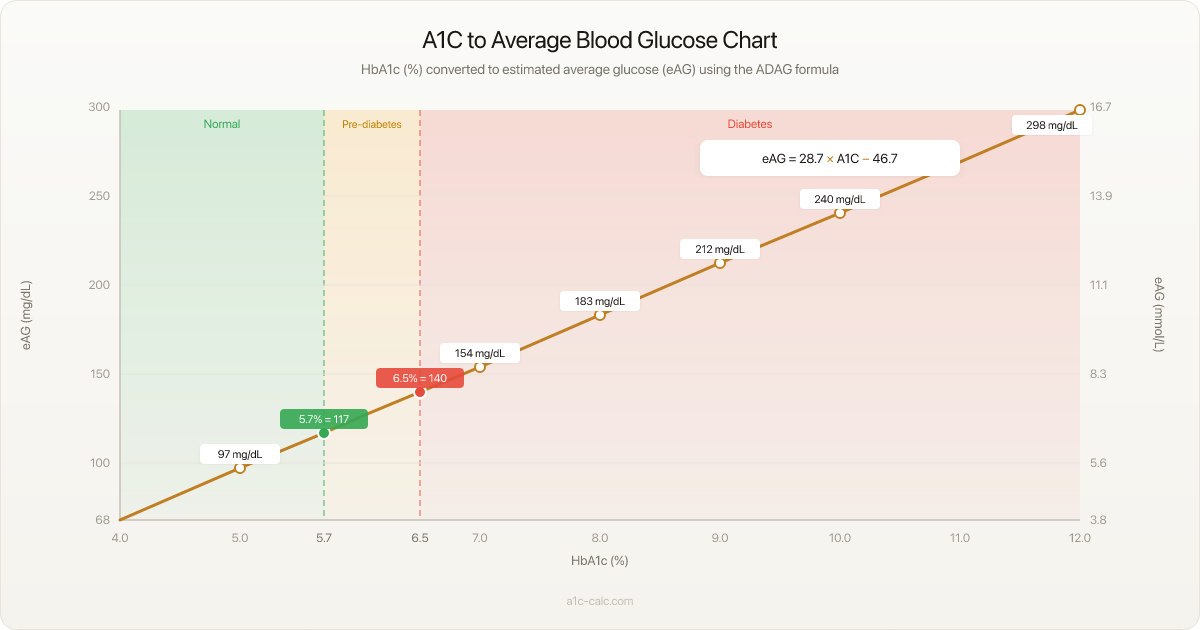
The table below converts HbA1c percentages to estimated average glucose (eAG) values in both mg/dL and mmol/L. All values are calculated using the ADAG formula.
If you are starting from a meter or CGM average, use the glucose to A1C conversion table below. A1C estimates a 2–3 month average, so do not use a single finger-stick reading as your average glucose.
Understanding the Categories
HbA1c to eAG Conversion Table
| HbA1c (%) | eAG (mg/dL) | eAG (mmol/L) | Category |
|---|---|---|---|
| 4.0% | 68 | 3.8 | Normal |
| 4.5% | 82 | 4.6 | Normal |
| 5.0% | 97 | 5.4 | Normal |
| 5.5% | 111 | 6.2 | Normal |
| 5.7% | 117 | 6.5 | Normal |
| 5.8% | 120 | 6.7 | Prediabetes |
| 5.9% | 123 | 6.8 | Prediabetes |
| 6.0% | 126 | 7.0 | Prediabetes |
| 6.1% | 128 | 7.1 | Prediabetes |
| 6.2% | 131 | 7.3 | Prediabetes |
| 6.3% | 134 | 7.4 | Prediabetes |
| 6.4% | 137 | 7.6 | Prediabetes |
| 6.5% | 140 | 7.8 | Diabetes |
| 7.0% | 154 | 8.6 | Diabetes |
| 7.5% | 169 | 9.4 | Diabetes |
| 8.0% | 183 | 10.2 | Diabetes |
| 8.5% | 197 | 10.9 | Diabetes |
| 9.0% | 212 | 11.8 | Diabetes |
| 9.5% | 226 | 12.6 | Diabetes |
| 10.0% | 240 | 13.3 | Diabetes |
| 10.5% | 255 | 14.2 | Diabetes |
| 11.0% | 269 | 14.9 | Diabetes |
| 11.5% | 283 | 15.7 | Diabetes |
| 12.0% | 298 | 16.5 | Diabetes |
Glucose to A1C Conversion Chart
This reverse chart converts estimated average glucose back to A1C. It is most useful when you have a 90-day CGM average or a consistent meter average.
| Average Glucose (mg/dL) | Average Glucose (mmol/L) | Estimated A1C | Category |
|---|---|---|---|
| 90 | 5.0 | 4.8% | Normal |
| 100 | 5.6 | 5.1% | Normal |
| 117 | 6.5 | 5.7% | Prediabetes threshold |
| 126 | 7.0 | 6.0% | Prediabetes |
| 140 | 7.8 | 6.5% | Diabetes threshold |
| 154 | 8.6 | 7.0% | Diabetes |
| 183 | 10.2 | 8.0% | Diabetes |
| 212 | 11.8 | 9.0% | Diabetes |
| 240 | 13.3 | 10.0% | Diabetes |
How Is eAG Calculated?
The estimated average glucose is derived from HbA1c using the ADAG study formula: eAG (mg/dL) = 28.7 × A1C − 46.7. For the reverse direction, use A1C = (eAG + 46.7) ÷ 28.7. This formula was established through a study that correlated A1C levels with continuous glucose monitoring data from 507 participants. Read more about how the ADAG formula works.
Important Notes
- These values are estimates. Individual variation exists based on red blood cell lifespan and other factors.
- Certain conditions — such as anemia, hemoglobin variants, or pregnancy — can affect HbA1c accuracy.
- Always discuss your results with a healthcare professional for proper interpretation.
- The ADA defines prediabetes as A1C 5.7%–6.4% and diabetes as 6.5% or above.
Sources
- Nathan DM, et al. Translating the A1C Assay Into Estimated Average Glucose Values. Diabetes Care. 2008;31(8):1473-1478.
- American Diabetes Association Professional Practice Committee. Glycemic Goals and Hypoglycemia: Standards of Care in Diabetes—2024. Diabetes Care. 2024;47(Suppl 1):S111-S125.